

Opportunities Landscape 2023 Findings
OVERALL FINDINGS
The 2023 report builds on baseline data from the Opportunities Landscape 2021 report, which provided data on programs operating in Baltimore City in the year ending in September 2019. Opportunities Landscape 2023 offers a post-COVID view of youth opportunities across the city and by age group, primary focus area, and neighborhood.
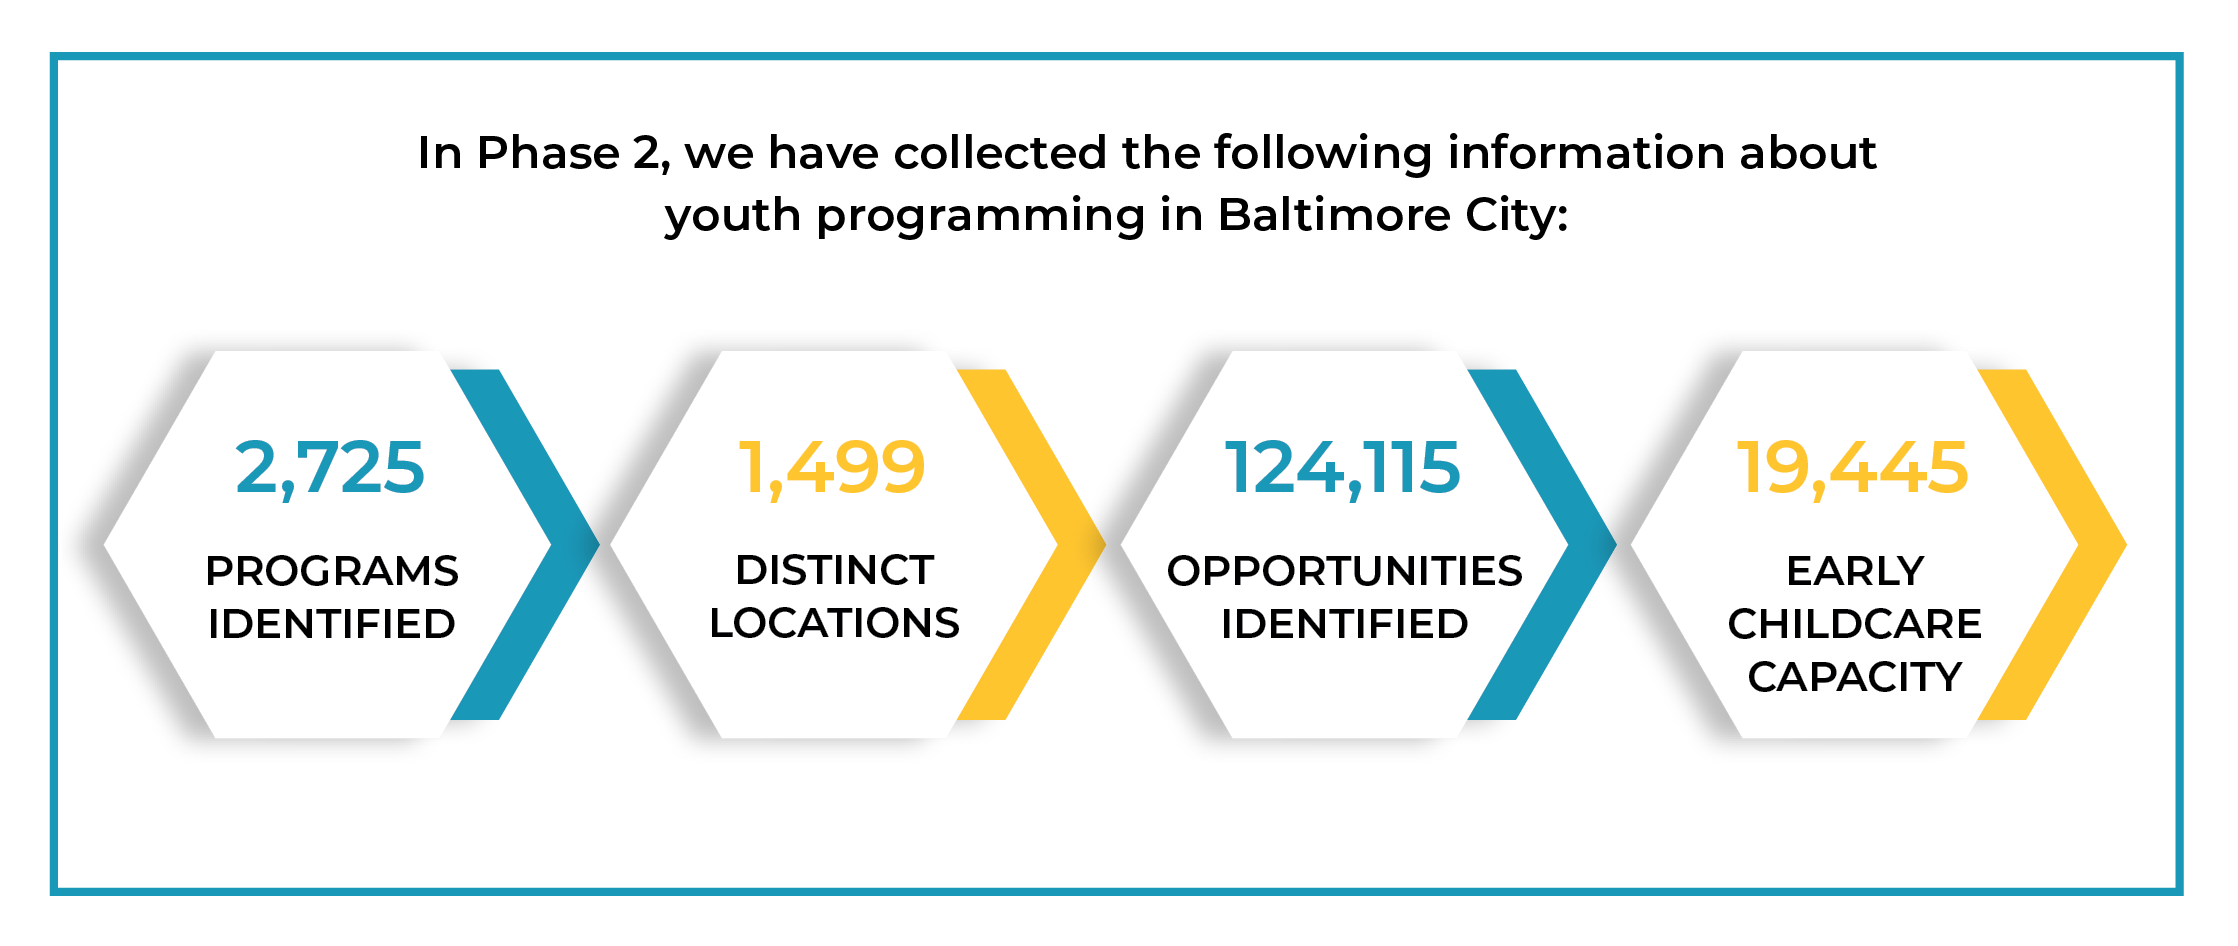
Our dataset identifies 2,725 program sites operating in 2022 in 1,499 distinct locations, offering 124,115 opportunities.
Youth opportunities are defined as programming for individuals age 0-24 that is distinct from — or designed to support or supplement — in-school instruction; “opportunities identified" refers to the total number of young people served, as reported by each data source. As many young people take advantage of multiple programs throughout the year, “opportunities identified” does not represent distinct individuals.
Early childcare capacity numbers are provided by the Maryland Family Network, whose dataset contains information on all licensed child care facilities in Maryland, including center-based and home-based care. Data on actual enrollment in childcare facilities (i.e., the number of opportunities) is not reported in the dataset. Thus, the 19,445 early childcare capacity figure is in addition to, not a subset of, the 124,115 opportunities identified figure.

PROGRAM INFORMATION BY AGE GROUP
Key Findings by Age Group

The most represented age group is elementary, in terms of both the number of programs and opportunities identified; this was also true in Opportunities Landscape 2021.
Around 52% of the programs in our 2023 dataset serve elementary-aged children, while just under a third (33.1%) of opportunities identified were available to this age group.
The number of opportunities available to older youth increased, from 7,952 in Opportunities Landscape 2021 data to 17,482 in this dataset. This may be due to better data collection and a coordinated effort by city stakeholders to increase opportunities for older youth as a result of Opportunities Landscape 2021 findings.
There are still 2.3 times more opportunities for elementary-aged youth than for older youth. This is an improvement from the last report, which showed four times more opportunities for the younger age group, but a significant gap in programming remains.
Visit our Older Youth Spotlight to learn more about how we used Opportunities Landscape 2021 data to advocate for more programs for older youth, how the Summer Funding Collaborative and Youth Grantmakers initiatives are helping increase quality programming for this important age group, and how non-summer-months opportunities may be the next frontier.

PROGRAM INFORMATION BY PRIMARY FOCUS AREA
Key Findings
Childcare, Academic Enrichment, and Workforce/Youth Development comprise the top three primary focus areas in terms of number of programs.
Childcare: 27.8% (Almost all from Maryland Family Network’s dataset on childcare locations.)
Academic Enrichment: 19.9%
Workforce/Youth Employment: 18.4% (The 419 Youthworks sites from the Mayor’s Office of Employment Development make up 83.6% of that total.)
Academic Enrichment, Health and Wellness, and Workforce/Youth Employment comprise the top three primary focus areas in terms of number of opportunities, making up 53.9%, 18.6% and 7.5% of the dataset, respectively.
An increase in the number of programs and opportunities with a primary focus area of Health and Wellness is a standout change from the Opportunities Landscape 2021. Compared with the 2021 report, Opportunities Landscape 2023 identified nearly five times the number of programs (270) and over eight times the number of opportunities (23,133) with this primary focus.
Of note, our Opportunities Landscape 2021 report included focus groups with young people and their parents and caregivers, who revealed their interest in youth-centered programs with engaged, professional staff who could provide safe mental health spaces. Our data indicates that program providers and funders have prioritized focusing on student well-being in response to this type of feedback and the detrimental effects of the pandemic on young people.
Program Information by Primary Focus Area

This interactive map displays all of the program sites in our dataset categorized by Primary Focus Area.
Note: Click top left map arrow to see legend
and + to zoom in

PROGRAM AND OPPORTUNITY INFORMATION BY NEIGHBORHOOD
One clear limitation to our dataset is that opportunities by neighborhood are calculated based on the locations of the program sites and not where individual participants live. Students may travel outside their own neighborhoods to attend programs — 66 programs serving Baltimore City youth are located outside of city limits. As mentioned in the Recommendations and Next Steps section, the emergence of the Baltimore City Youth Data Hub will illuminate this information.
Assessing Neighborhood Need, Programs, and Opportunities
We use two metrics to measure neighborhood need when analyzing whether the programs and opportunities in our dataset meet the relative needs of different neighborhoods in Baltimore City:
Percent of children living below the poverty line (2017-2021), a U.S. Census statistic sourced by the Baltimore Neighborhood Indicators Alliance: Child poverty rates in the city range from 0% in Inner Harbor/Federal Hill to 68.8% in Sandtown-Winchester/Harlem Park.
Community Conditions Index (CCI), developed by Baltimore City Schools to quantify investment in Baltimore neighborhoods based on economic disparity, access to resources, and neighborhood stability and safety: The index ranges from 6 (indicating low investment) to 24 (indicating high investment), with lower scores representing higher needs.
The interactive charts and data tables below show the relationship between neighborhood need and the number of programs and opportunities in our 2023 dataset.
The interactive map shows the number of program sites by Community Statistical Area (CSA) Neighborhood.*
*The dataset includes 66 programs that serve Baltimore City youth outside of city limits, 17 virtual programs, and 66 programs with an unknown location. To learn more about CSA Neighborhoods, why they exist, and how they differ from what a Baltimore resident may classify as a neighborhood, please visit the Baltimore Neighborhood Indicators Alliance.
The interactive map shows the number of opportunities by Community Statistical Area (CSA) Neighborhood.**
**The dataset includes programs that provide 4,611 opportunities outside of city limits and 924 virtually; 700 opportunities are part of programs with unknown locations.
Our analysis finds a significant relationship between neighborhood need (based on both child poverty rate and CCI) and the number of programs available to young people. In general, neighborhoods with higher needs have greater numbers of programs, though we found plenty of exceptions.
For example, the Poppleton/The Terraces/Hollins Market CSA Neighborhood has the second highest child poverty rate in the city (66.6%) and the lowest possible CCI score (6). However, it is home to only 37 programs in our dataset, ranking 33rd of the 55 CSA Neighborhoods in the city. Similarly, Madison/East End has the eighth highest child poverty rate (47.0%) and the eighth lowest CCI score (8) — but only the 42nd most programs of neighborhoods in the city. Though both neighborhoods are surrounded by others with relatively high numbers of programs, the data shows that despite the promising relationship between neighborhood need and number of programs, not all neighborhoods in the city have an adequate number of programs.
Concerningly, we do not find a similarly strong relationship between neighborhood need and the number of opportunities. Some neighborhoods with high needs have a relatively high number of programming opportunities. For example, the Upton/Druid Heights neighborhood in West Baltimore has the third highest child poverty rate in the city (58.1%) and the third highest number of opportunities (5,937). However, many neighborhoods with high needs have relatively few programming opportunities. The Westport/Mount Winans/Lakeland neighborhood, for example, has the fourth highest child poverty rate in the city (54.7%) but only the 33rd highest number of opportunities (1,416).
In short, there is still considerable work ahead to improve the number of programs and opportunities for young people in neighborhoods with the highest needs.